Illustrations show COVID hospitalization data for North Carolina and Triangle
READ MORE
The COVID Burnout
It has been almost exactly two years since the U.S. Centers for Disease Control and Prevention identified the nation’s first lab-confirmed case of the coronavirus. Today, COVID cases and hospitalizations continue to climb. The News & Observer recently spoke to people in the Triangle about how they are handling the stress of this pandemic. Here are their stories in our special report: The COVID Burnout.
Expand All
What’s COVID’s effect on the Triangle? Here are 7 reactions, from burned out to dismissive

Despite COVID surge, restaurant employees have to act like everything’s normal
Have pandemic questions and need advice? Ask Josh, our COVID counselor
.jpeg)
‘Best way to describe it is chaotic’: Pandemic reframes UNC student’s college experience
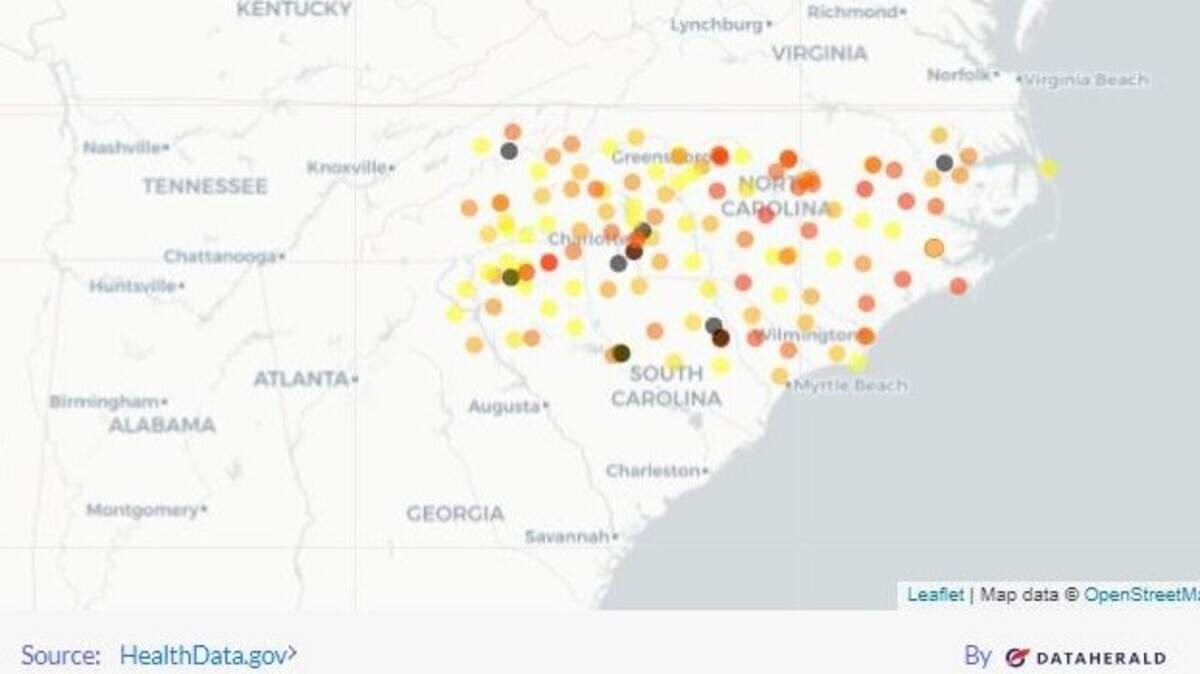
Illustrations show COVID hospitalization data for North Carolina and Triangle
These COVID-19 graphics show hospitalization rates and ICU usage across North Carolina and in the Triangle region.
Hospitalization and ICU usage data is updated daily. The hospital bed occupancy data is updated weekly.
Bookmark this page and return to it for updated information.
North Carolina hospitalizations, ICU usage
North Carolina hospital bed occupancy
This story was originally published January 5, 2022 at 2:42 PM.