N&O analysis shows extent of aggressive gerrymandering in new NC political maps
READ MORE
North Carolina redistricting
Expand All
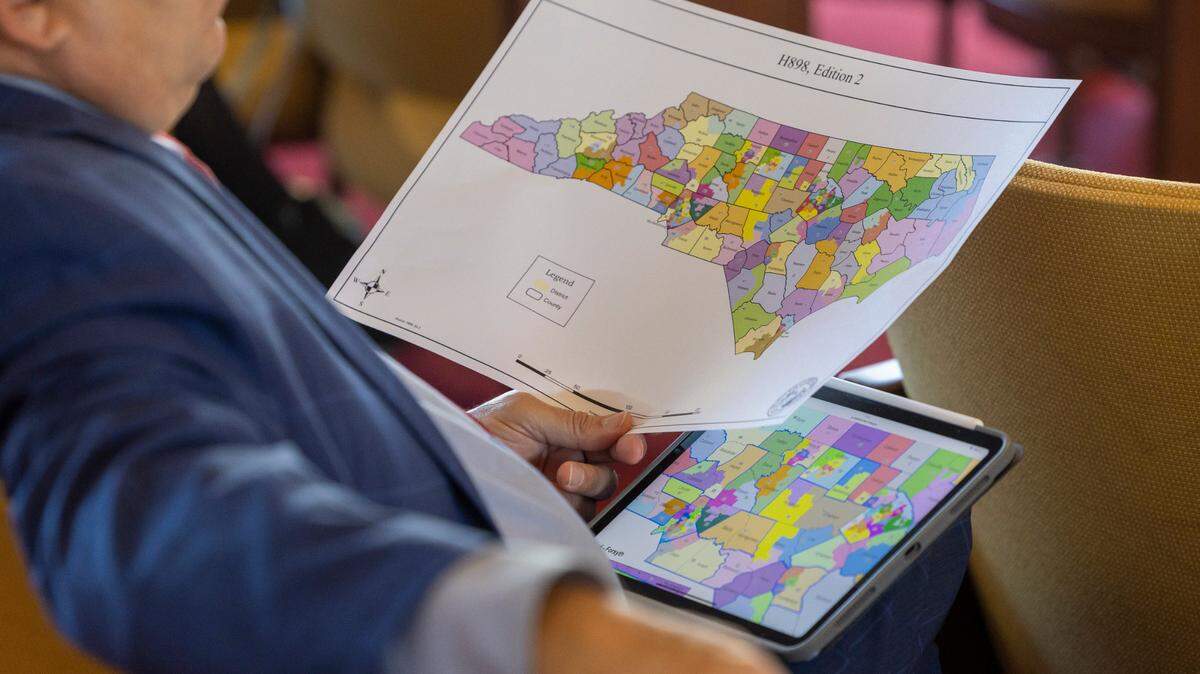
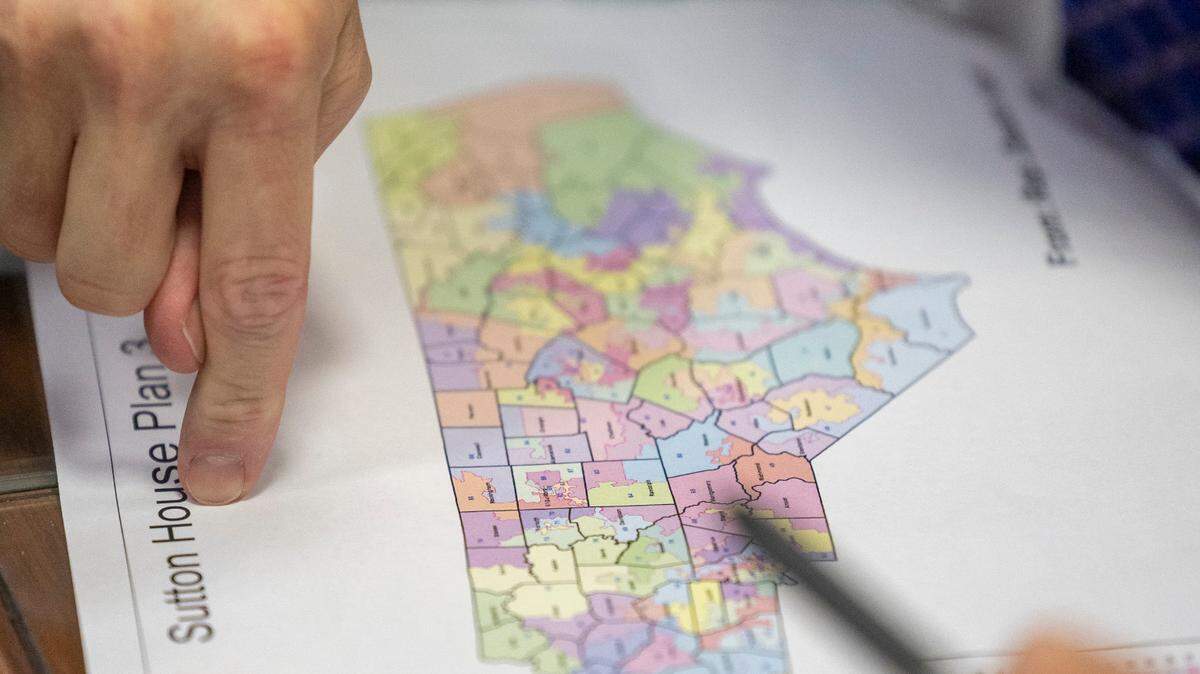
The newest political maps from Republican lawmakers show strong evidence of partisan gerrymandering likely to help the GOP gain an edge in Congress and protect its majorities in the state legislature, according to a News & Observer analysis.
With conservative-dominated state and federal courts unlikely to rein in the worst abuses of political mapmaking, Republican gains from the maps approved Wednesday are likely to continue for years to come.
“It looks like, as we would have expected, that the deck is pretty stacked,” said Irving Joyner, an N.C. Central University law professor who’s been active in fights against racially discriminatory maps in this state for years.
The N&O analysis compared the performance of the enacted district maps to that of tens of thousands of maps created by a team of mathematicians at Duke University, using vote counts from previous elections.
The Duke team’s findings have been submitted to the U.S. Supreme Court and North Carolina state courts as evidence that previous political maps were extreme partisan gerrymanders. They were among the arguments that convinced state judges that previous Republican-drawn district maps violated the North Carolina constitution.
What the analysis found
The N&O analysis shows that among the tens of thousands of computer-generated maps, vanishingly few favor Republicans as much as the enacted plans, which state lawmakers hold the power to approve without the signature of Democratic Gov. Roy Cooper.
The Duke team confirmed The N&O’s findings, and in a blog post Friday said their own analysis found the maps are even more gerrymandered than those Republicans drew in 2021.
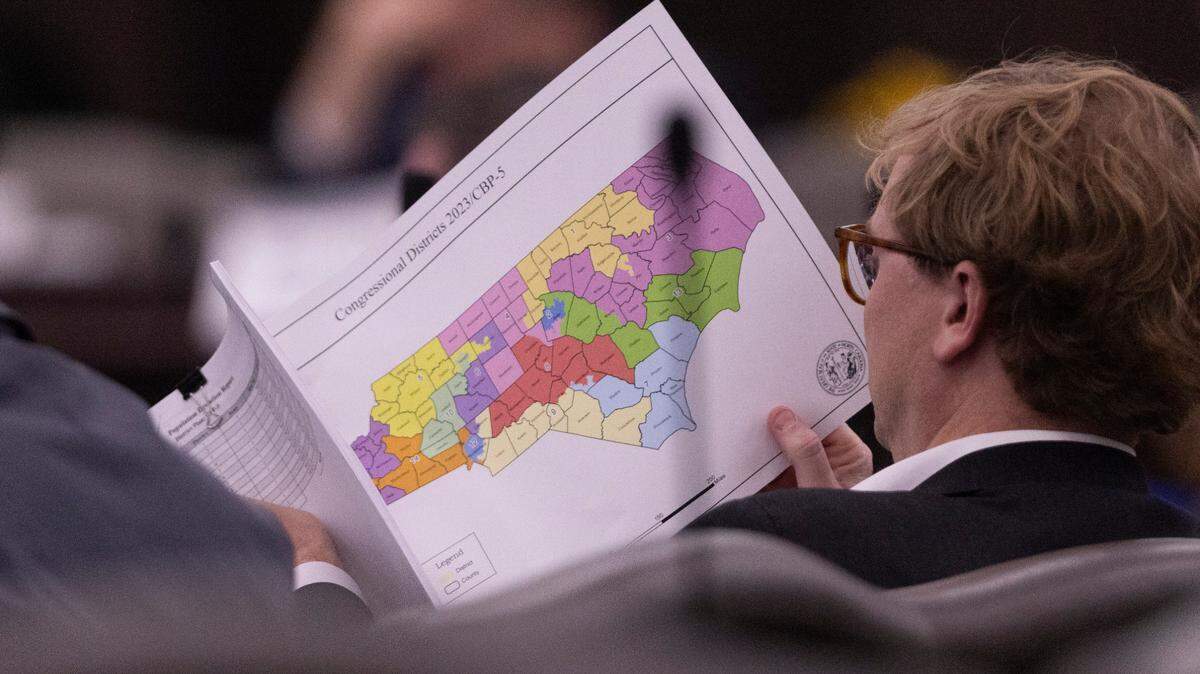
That’s especially true of the two U.S. House maps that legislators had proposed, said Duke math professor Jonathan Mattingly, who leads the research team. No matter how the well Democrats perform, simulation after simulation shows almost no change in the makeup of the congressional delegation, reliably electing 10 or 11 Republicans compared to the current 7-7 party split.
“The maps the legislature have proposed essentially negate the need to have elections for the U.S. House of Representatives,” Mattingly said in an interview Oct. 20.
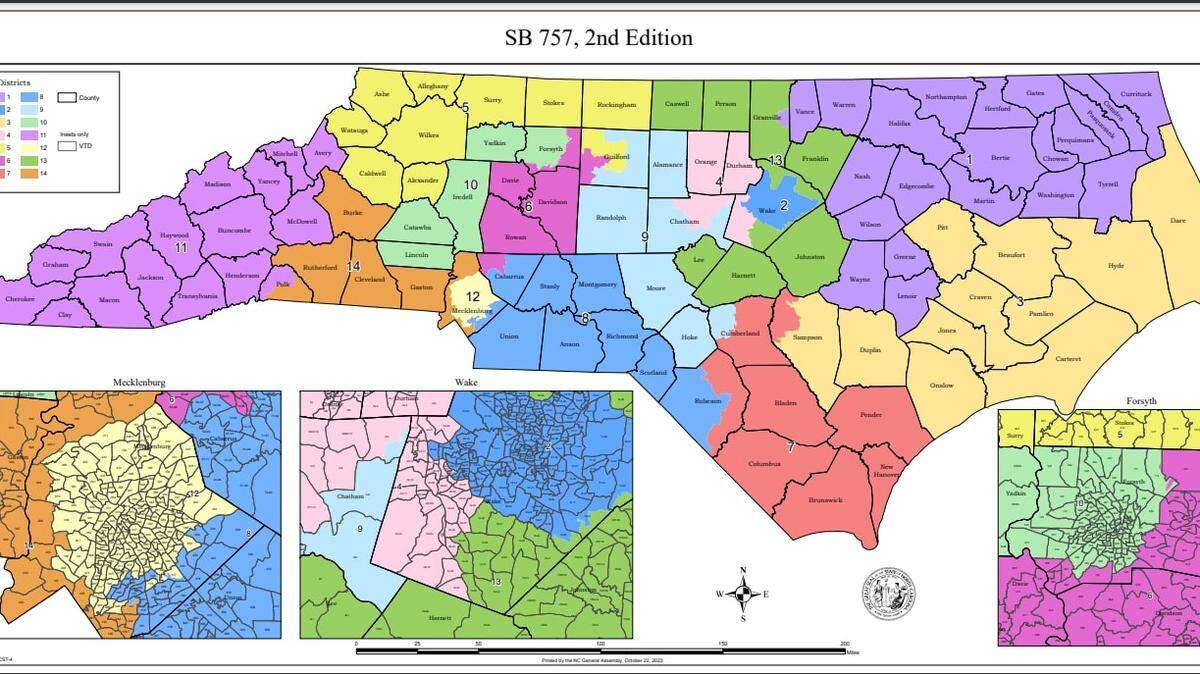
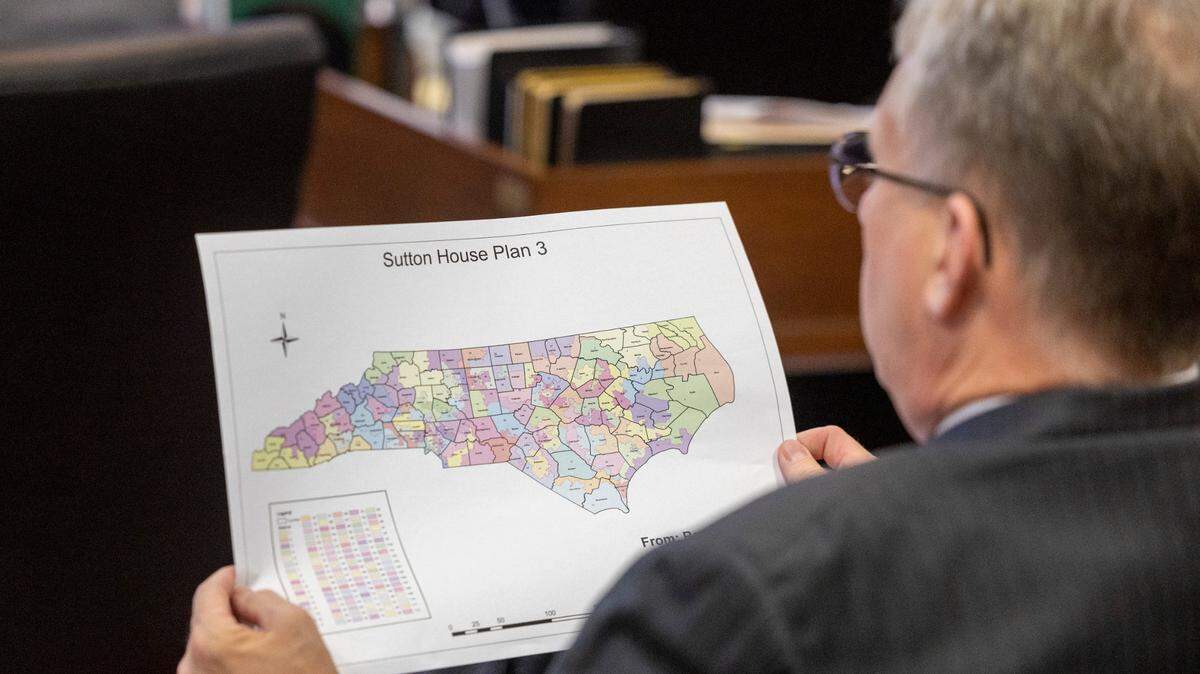
Republican lawmakers ended up passing the congressional map slightly more favorable to Democrats than their other proposal. But the enacted map is still largely out of sync with nearly 80,000 possible maps created by researchers — especially in election scenarios where Democrats approach or slightly exceed the majority of the popular vote statewide.
Western Carolina political science professor Chris Cooper, a close observer of North Carolina politics who reviewed The N&O’s findings, said that although “there is no silver bullet in redistricting analysis,” he sees clear signals that the maps are particularly good for Republicans.
“They look fairly similar to maps that have been struck down in recent years by the courts,” Cooper said. “With the state supreme court we had two years ago, these maps may have crossed the line.”
But times have changed.
After Republican justices captured the majority of the state Supreme Court in the 2022 election, they quickly reversed course from previous decisions, declaring that partisan gerrymandering was a political issue, not a judicial one.
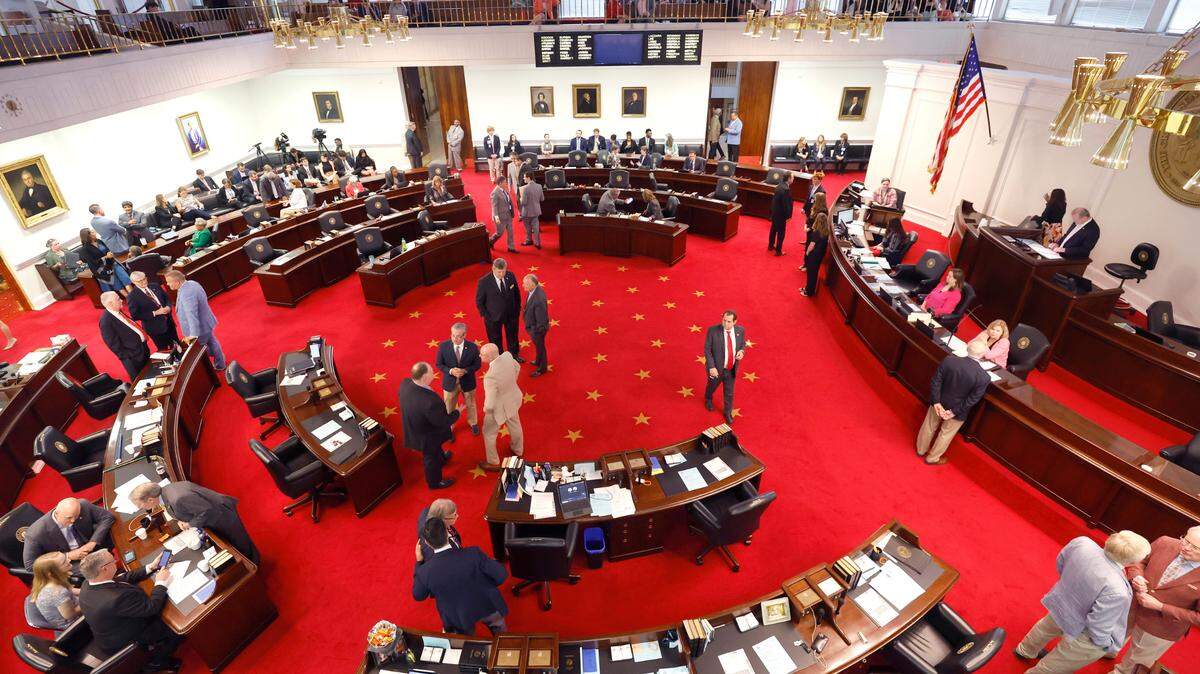
Republican leaders, who for the first time in several redistricting cycles created maps behind closed doors, contend the maps will withstand legal scrutiny. And they say the newly enacted plans give voters — not the courts — ample opportunity to determine the balance of political power.
“It doesn’t lock in any majority at all for the rest of the decade. Anybody who thinks that, they’re making a mistake,” Republican state Rep. Destin Hall, who chairs the House redistricting committee, told reporters Oct. 19. “We’ve still got to go out and campaign very hard. What will determine if we have majorities in this body will be the principles that we’ve passed throughout this decade and this session as well.”


Andy Taylor, professor of political science and director of the Free and Open Societies Project at N.C. State University, told The N&O after reviewing the paper’s analysis that he wasn’t surprised to see a Republican bias in the maps “given that legislators are human beings with political interests that computers don’t have.”
But Taylor, who served as an expert witness for Republican leaders during past redistricting cases, also noted that he’s skeptical of conclusions about voting patterns in the proposed districts far into the future — especially for a set of maps meant to last through 2030.
“That this is a road to the promised land for Republicans for the next 6 years and a death sentence for Democrats — that’s exaggerated,” Taylor said.
While he said it’s not hard for a political party to gerrymander in its favor, it’s much more difficult to ensure a biased map holds up to the chaos of the American electorate, which moves, grows and changes its mind based on candidates and issues of the day.
If mapmakers miscalculate, he said, they can end up creating a “dummymander” that can backfire when it fails to account for political changes.
“It’s hubris, I think, on the part of legislators who are sitting there rubbing their hands in glee that they know exactly what the election is going to be like in 2028,” Taylor said.

When swings don’t translate to seats
But Cooper takes the opposite view. The voting public in the U.S. has broadly hardened their opinions, he said, and communities have grown more solidly partisan as people have gravitated to places where others think — and vote — like themselves.
“American politics is increasingly — not decreasingly — predictable,” Cooper said.
He noted that opinion poll after opinion poll shows that voters — conservative or liberal — say they oppose partisan gerrymandering. But as long as voters agree with the party in power on more high-priority issues like abortion or tax policy, they’re often unwilling to penalize politicians for drawing unfair maps at the ballot box.
“It’s a great example where most people agree, but most people agree it’s not the most important issue,” Cooper said.
And that means partisan gerrymandering, whether by Democrats or Republicans, can feed a related problem in politics: it can insulate elected representatives from public opinion.
Cooper said The N&O’s analysis also shows that if voters’ positions do shift — a “blue wave,” for example — the Republican maps are particularly resistant to swings in political sentiment. Under the conditions of these maps, he said, it would take much larger swings in voting patterns to wrest, for example, the legislative majority from Republican control.
In N.C., lawmakers have incredible mapmaking power
In the end, strong evidence of partisan gerrymandering might not really matter, Taylor said.
Especially given the current state Supreme Court makeup, state lawmakers — and the party in charge — have incredible power to craft district lines.
“Of all the states in the union, the North Carolina constitution gives legislators more authority to do redistricting than any other state does — for better or worse,” Taylor said.
Even if tens of thousands of computer-generated map options appear more “fair,” he said, that’s unlikely to change the process. At least for now.
“It doesn’t matter what a Duke mathematician says,” Taylor said. “He or she has no constitutional authority at all.”
Whether courts step in or not, Cooper said there is value in deep dives into the maps to help the public see how their democracy works — or doesn’t
“It’s critically important for people to understand how their vote is likely to translate into representation,” Cooper said.
EDITOR’S NOTE: This story and the N&O’s findings were updated Oct. 26 to account for maps enacted by the N.C. General Assembly on Oct. 25, which state lawmakers amended slightly after they were initially filed.
This story was originally published October 23, 2023 at 5:30 AM.
CORRECTION: A previous version of this story incorrectly reported the number of maps created by Duke University mathematicians for the congressional analysis. The team created 100,000 each for the state House and state Senate and about 80,000 for the U.S. House.


.JPG)